100×worker · job analysis
Will AI Replace Statisticians?
Statisticians spend much of their week on tasks that follow a repeatable pattern: cleaning a spreadsheet, running a standard test, building the same quarterly dashboard. Microsoft Research analyzed 200,000 real Copilot conversations across occupations and gave statistical assistants an AI applicability score of 31.8%, meaning generative AI can plausibly handle roughly a third of the work activities in the role (Microsoft Research, Working with AI, 2025). That sits well below translators (49%) and well above nurses (12%), which tells you something: statistics work is heavy on data mechanics but also heavy on judgment.
Anthropic's Economic Index, which classifies millions of Claude conversations against O*NET task categories, finds a similar split across knowledge work between automation (AI does the task alone) and augmentation (AI helps a person do it faster). For statisticians, augmentation dominates, because most statistical work depends on context a model does not have: what the client actually needs, what decision the numbers will support, what a wrong assumption would cost downstream. Adoption keeps climbing regardless: Eurostat found that 32.7% of the EU population aged 16 to 74 used generative AI in the three months before being surveyed in 2025.
This article breaks the statistician role into four buckets, using the ESCO occupational description (code 3314.2) as the task baseline, so you can see exactly where AI already does the work, where it needs a human check, and where the job stays yours.
A statistician collects and analyzes data, applies statistical methods, and translates results into reports and advice.
The task split: what AI takes over and what stays yours
Not every task in a statistician's job responds to AI the same way. Some tasks disappear because a script or an OCR tool now does them without a human in the loop. Some get a first pass from AI that a person still has to check. Some are best split between AI drafting and human review. And some stay entirely human because they involve judgment, accountability, or a relationship with the person who asked for the numbers in the first place. Sorting your actual weekly task list into these four buckets, eliminate, automate, delegate, keep, is more useful than any single percentage.
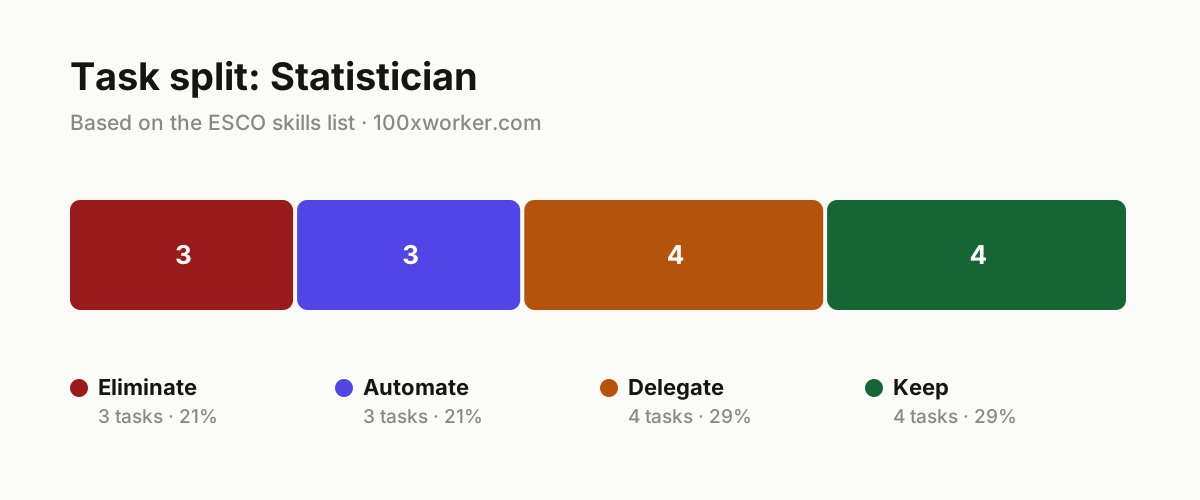
| Task | Bucket | Why |
|---|---|---|
| Manually retyping data from PDFs, scanned forms, or old spreadsheets into your analysis software | eliminate | Recognizing and transferring structured data is an OCR and scripting job, not statistical work. |
| Drawing standard charts and graphs for recurring routine reports | eliminate | A script produces the same bar chart in seconds that used to take an hour in Excel or SPSS. |
| Cleaning data according to a fixed protocol (duplicates, error codes, missing values) | eliminate | Rule-based cleaning follows a protocol a script repeats flawlessly and without fatigue. |
| First drafts of recurring reports (quarterly figures, fixed-format dashboards) | automate | The structure is set and only the numbers change, ideal for an AI agent filling a template. |
| Generating descriptive statistics and basic visualizations from a raw dataset | automate | Means, spread, and first-pass charts are mechanical once the data is clean. |
| Turning survey results into summary tables and cross-tabs | automate | Fixed question structure and fixed output mean an agent can deliver this production-ready. |
| Selecting and testing statistical techniques (regression, hypothesis tests, model choice) on new data | delegate | AI proposes usable first options, you judge whether the assumptions and the data justify them. |
| Drafting technical reports and work-related write-ups | delegate | AI produces a readable first version, you rewrite the conclusions and check every numerical claim. |
| Spotting patterns and anomalies in large datasets as a starting point for hypotheses | delegate | AI finds correlations across thousands of rows faster, you decide which one deserves investigation. |
| Drafting survey questions and study design based on the research question | delegate | AI writes a first questionnaire, you check it for bias, validity, and fit with the target group. |
| Interpreting results in the client's policy or business context | keep | Numbers only become meaningful once you know what decision the organization needs to make. (Your edge: Understanding the client's context and stakes stays human work.) |
| Methodological quality control: is this test, sample, or model actually right here | keep | A wrong method choice produces convincing but incorrect numbers, and that risk sits with you. (Your edge: Taking responsibility for a flawed method choice cannot be handed to a model.) |
| Talking with the client about the research question, scope, and expectations | keep | Finding the real question behind the question takes listening and follow-up, not data work. (Your edge: Building trust in a conversation is not something a chatbot does for you.) |
| Final accountability and sign-off on published figures (for example official statistics) | keep | Someone has to stand behind the accuracy of published numbers, by name and by title. (Your edge: Public accountability stays legally and professionally attached to a person.) |
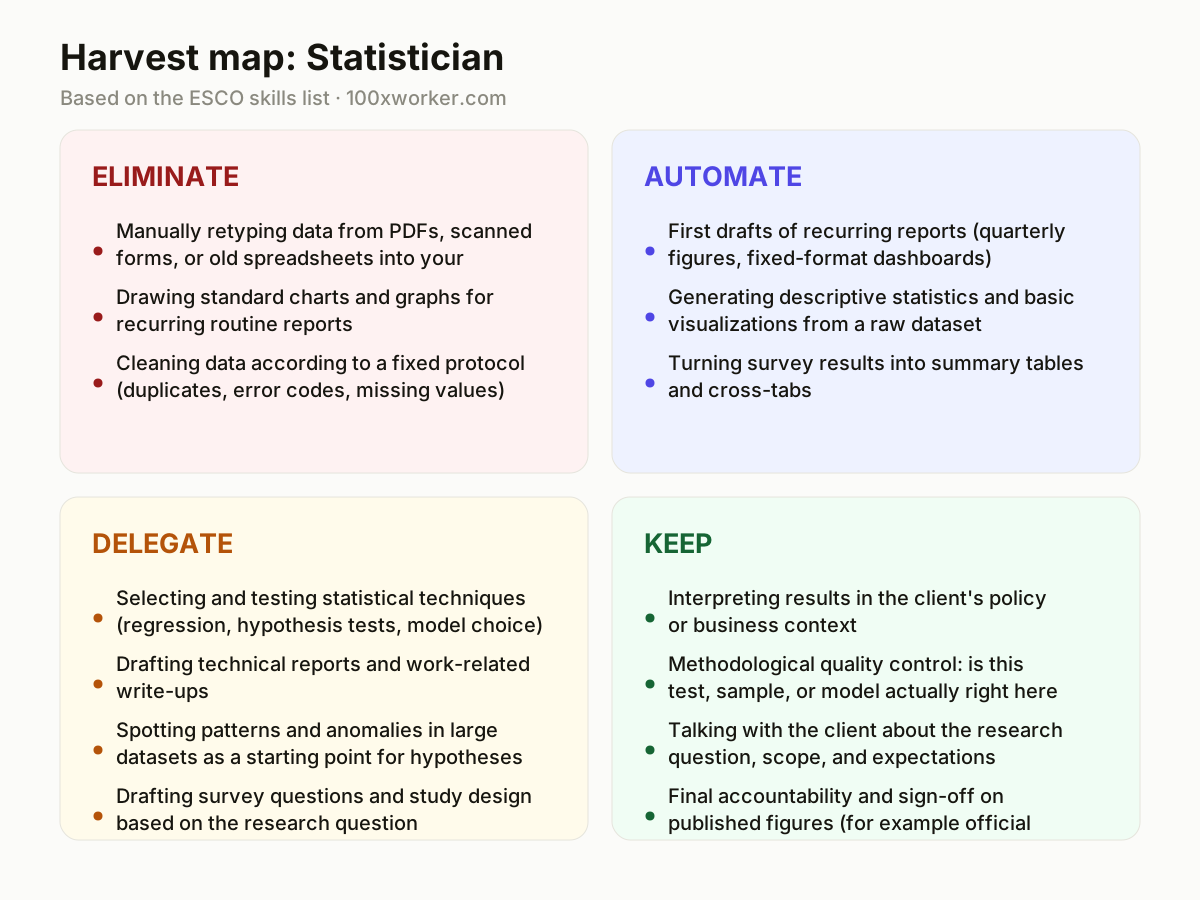
Which statistician tasks does AI take over?
AI already handles the mechanical layer of the job well: retyping data from scans and PDFs, cleaning datasets against a fixed protocol, drawing standard charts, and producing first-draft descriptive statistics or summary tables. These are eliminate- and automate-bucket tasks, meaning they either disappear entirely or get a full first pass from an AI tool with minimal human editing. What AI does not take over is choosing which method fits the data, writing the interpretation a client will act on, or deciding what a result actually means for a policy or business decision. Those stay with a person who understands the context behind the numbers.
Will AI replace statisticians?
No single occupation disappears because of an applicability score of 31.8%. Microsoft Research's figure means about a third of typical statistical-assistant work activities can already be handled by generative AI, not that a third of statisticians are redundant. Anthropic's Economic Index shows the same pattern: most AI use in analytical work is augmentation, a human still directing and checking the work, rather than full automation. The role shifts toward tasks AI cannot do well: judging whether a method fits the data, catching a flawed assumption before it reaches a report, and taking accountability for published figures. Statisticians who use AI for the routine layer and keep the judgment layer are likely to do more, not less, of the job.
How do you become the AI person on your statistics team?
Start by mapping your team's recurring reports and identifying which ones follow a fixed template. Build a working prompt or script that produces a first draft of each one, then have a colleague test it against last quarter's actual output. Document what the AI got wrong (a mislabeled category, a missing edge case) so the whole team learns the failure modes rather than repeating the same fix individually. Volunteer to review AI-drafted interpretations before they go to clients, since that is where errors are costliest and where your judgment adds the most value. Being the person who knows exactly where AI output needs checking is more useful than being the person who avoids the tools.
What can you do this month as a statistician?
Pick one recurring report you produce every month or quarter and time how long it currently takes. Rebuild the data-cleaning and charting steps using a script or an AI tool, and measure the new time. Use the hours you free up to do one thing you normally skip: a deeper methodological check, a longer conversation with the person who requested the report, or a second look at an assumption you usually take for granted. Repeat with a second report next month. Small, measured swaps like this show you concretely where AI applicability sits inside your own job rather than in a general industry average.
Across occupations, generative AI's applicability ranges from 12% for nurses to 49% for translators, with statistical assistants at 31.8%.
Microsoft Research, Working with AI (2025)
Become the AI person on your team
Build a template library for AI-drafted reports
Collect the fixed-structure reports your team produces (quarterly dashboards, standard cross-tabs) and turn each into a prompt or script with the data source and output format specified. Keep a version history so you can compare AI drafts against past human-written versions.
Run a monthly method-check review
Set aside time each month to review one AI-suggested statistical technique against the actual data and assumptions. Log cases where the suggestion did not hold up, so the team builds a shared record of where AI reasoning fails on your specific data.
Own the client conversation, not just the output
When AI drafts the first version of a report or interpretation, use the time saved to have a longer conversation with the requester about what decision the numbers will support. That conversation, not the drafting, is where your judgment matters most.
Want this for your actual task list?
The free scan on the homepage builds your personal task map in 30 seconds, based on your role and industry.
Run the free task scanTools for this work
| Tool | For which tasks | The sober take |
|---|---|---|
| ChatGPT or Claude | Drafting technical reports, summarizing findings, generating first-pass survey questions (delegate bucket) | Useful for a first draft, but every numerical claim still needs a manual check against the actual data. |
| Python with pandas and statsmodels, plus an AI coding assistant | Data cleaning, descriptive statistics, and model testing (automate and delegate buckets) | The assistant speeds up writing the code, you still verify the statistical logic behind it. |
| OCR and document-extraction tools (e.g. Adobe Acrobat, ABBYY) | Extracting structured data from PDFs and scanned forms (eliminate bucket) | Handles the retyping problem well, but scanned tables with irregular formatting still need spot checks. |
| Power BI or Tableau with built-in AI features | Building standard charts and dashboards for recurring reports (eliminate and automate buckets) | Good for repeatable visuals, less reliable for judgment calls about which metric actually matters. |
Prompts to try today
First-draft quarterly report
Method sanity check
Survey question review for bias
Related jobs
Frequently asked questions
What percentage of a statistician's job can AI do?
Microsoft Research's analysis of 200,000 Copilot conversations gave statistical assistants an AI applicability score of 31.8%, meaning generative AI is demonstrably applicable to roughly a third of typical work activities in the role. This is a measure of task applicability, not a prediction of job loss. It sits below translators (49%) and above nurses (12%), reflecting that statistics work mixes mechanical data tasks with judgment-heavy analysis and client communication.
Does AI use in statistics mean automation or augmentation?
Anthropic's Economic Index, which classifies millions of Claude conversations against O*NET task categories, shows that for analytical roles like statistics, augmentation (AI helping a person work faster) is more common than full automation (AI completing a task with no human involvement). Statisticians tend to use AI to speed up drafting, coding, and first-pass analysis, then apply their own judgment to interpretation and method selection.
How many people actually use generative AI at work in Europe?
Eurostat found that 32.7% of the EU population aged 16 to 74 used generative AI in the three months before being surveyed in 2025. Separately, a Google/Ipsos study found that 61% of Belgian adults had used an AI chatbot in 2025. Adoption is uneven by age and role, but the trend across sources points to steady, ongoing growth rather than a plateau.
Should I still learn statistical software if AI can write code for me?
Yes. AI coding assistants speed up writing scripts in Python, R, or SPSS syntax, but they do not know whether a regression model fits your data's structure or whether a sample is biased. You need enough hands-on knowledge of statistical software and methods to catch a wrong suggestion, because the responsibility for a flawed analysis stays with you, not with the tool that drafted the code.
Sources
- Microsoft Research, Working with AI: Measuring the Applicability of Generative AI to Occupations (2025)
- Anthropic Economic Index
- Eurostat, Use of generative AI (isoc_ai_iaiu)
- ESCO, European Commission occupational taxonomy
Hendrik De Winne, author of Becoming AI-Savvy, founder of VibeLab. Helps teams redesign their work with AI.
This article was drafted with AI assistance from public data sources and editorially reviewed.